
Astronomers have unveiled one of the most ambitious maps of the early universe to date, revealing a vast “sea of light” between galaxies that had otherwise remained hidden in previous surveys.
Using data from the Hobby-Eberly Telescope Dark Energy Experiment (HOTDEX), scientists created a 3D map of light emitted by excited hydrogen 9 to 11 billion years ago, when universe was in the throes of “cosmic noon”, its peak epoch of star formation. This specific form of light, known as Lyman-alpha, is produced when hydrogen atoms are energized by radiation from young, hot stars, creating a distinctive ultraviolet glow that can be traced across vast cosmic distances.
“Lyman alpha radiation is an important property of galaxies at this period in the history of the universe, an era of powerful star formation,” study co-author Robin Ciardullo said in the statement. “Prior to this study, the location of fainter galaxies and gas, which also emits Lyman alpha radiation, has remained largely unknown.”
Other giant maps of the universe has focused on cataloging individuals galaxies — cosmic cities of light bright enough to stand out against the darkness. These investigations have been crucial to trace structure on a large scale and study dark energy. But they miss something important: the faint glow of hydrogen gas and small, dim galaxies that lie between the bright beacons.
“There is an entire ocean of light in the seemingly empty spots in between,” Maja Lujan Niemeyer, lead author of the study, said in the statement.
The new map was created using a technique called Line Intensity Mapping. Instead of identifying galaxies one by one, astronomers measured the combined light of hydrogen’s characteristic Lyman-alpha wavelength across vast swaths of sky. Hydrogenthe universe’s most abundant element, emits this ultraviolet light when it is supplied with energy from young stars. By tracking the glow, scientists can track not only bright galaxies, but also the diffuse gas that surrounds and connects them.
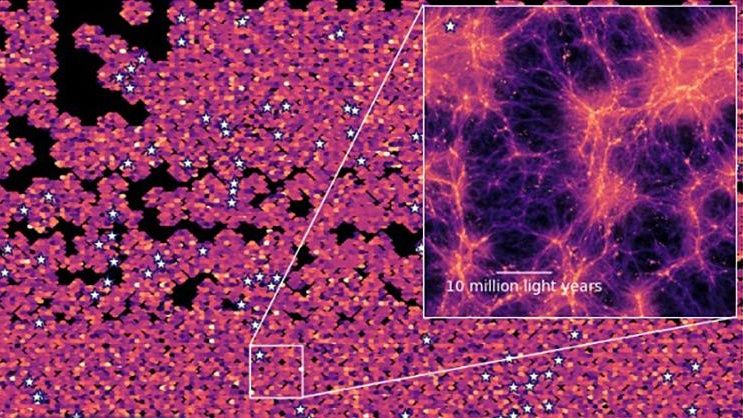
The result is less like a sharp city map and more like a heat map of all lighting – capturing the entire “sea of light” threading through the cosmic web. That makes it a powerful new tool for studying how galaxies formed and evolved in their environments, and the role intergalactic gas played.
The map was built from a huge data set comprising over 600 million spectra collected by HETDEX, originally designed to measure the universe’s expansion and investigate dark energy. By mining this archive and using supercomputers with custom programming to analyze the large data set, researchers reconstructed a 3D view of hydrogen distribution across a vast cosmic volume. Because matter clumps underneath gravitythe team was able to use the positions of known bright galaxies to help interpret the fainter background glow, revealing hidden structures that previous surveys could not directly detect.
By mapping hydrogen beneath the universe’s most active star-forming eragives astronomers a clearer picture of how galaxies pulled in gas, formed stars and assembled into the large-scale structures we see today. The work also signals a broader shift in cosmic cartography: future surveys may increasingly rely on intensity mapping to reveal not only the brightest objects in universebut the full, glowing frame that binds them together.
“This study is an exciting first step in using intensity mapping to understand the processes involved in how galaxies form and evolve,” Caryl Gronwall, co-author of the study, said in the statement. “The combination of the pioneering Hobby-Eberly telescope with new complementary instruments ushers in a golden age for mapping the cosmos.”
Their findings were published March 3 in The Astrophysical Journal.


