
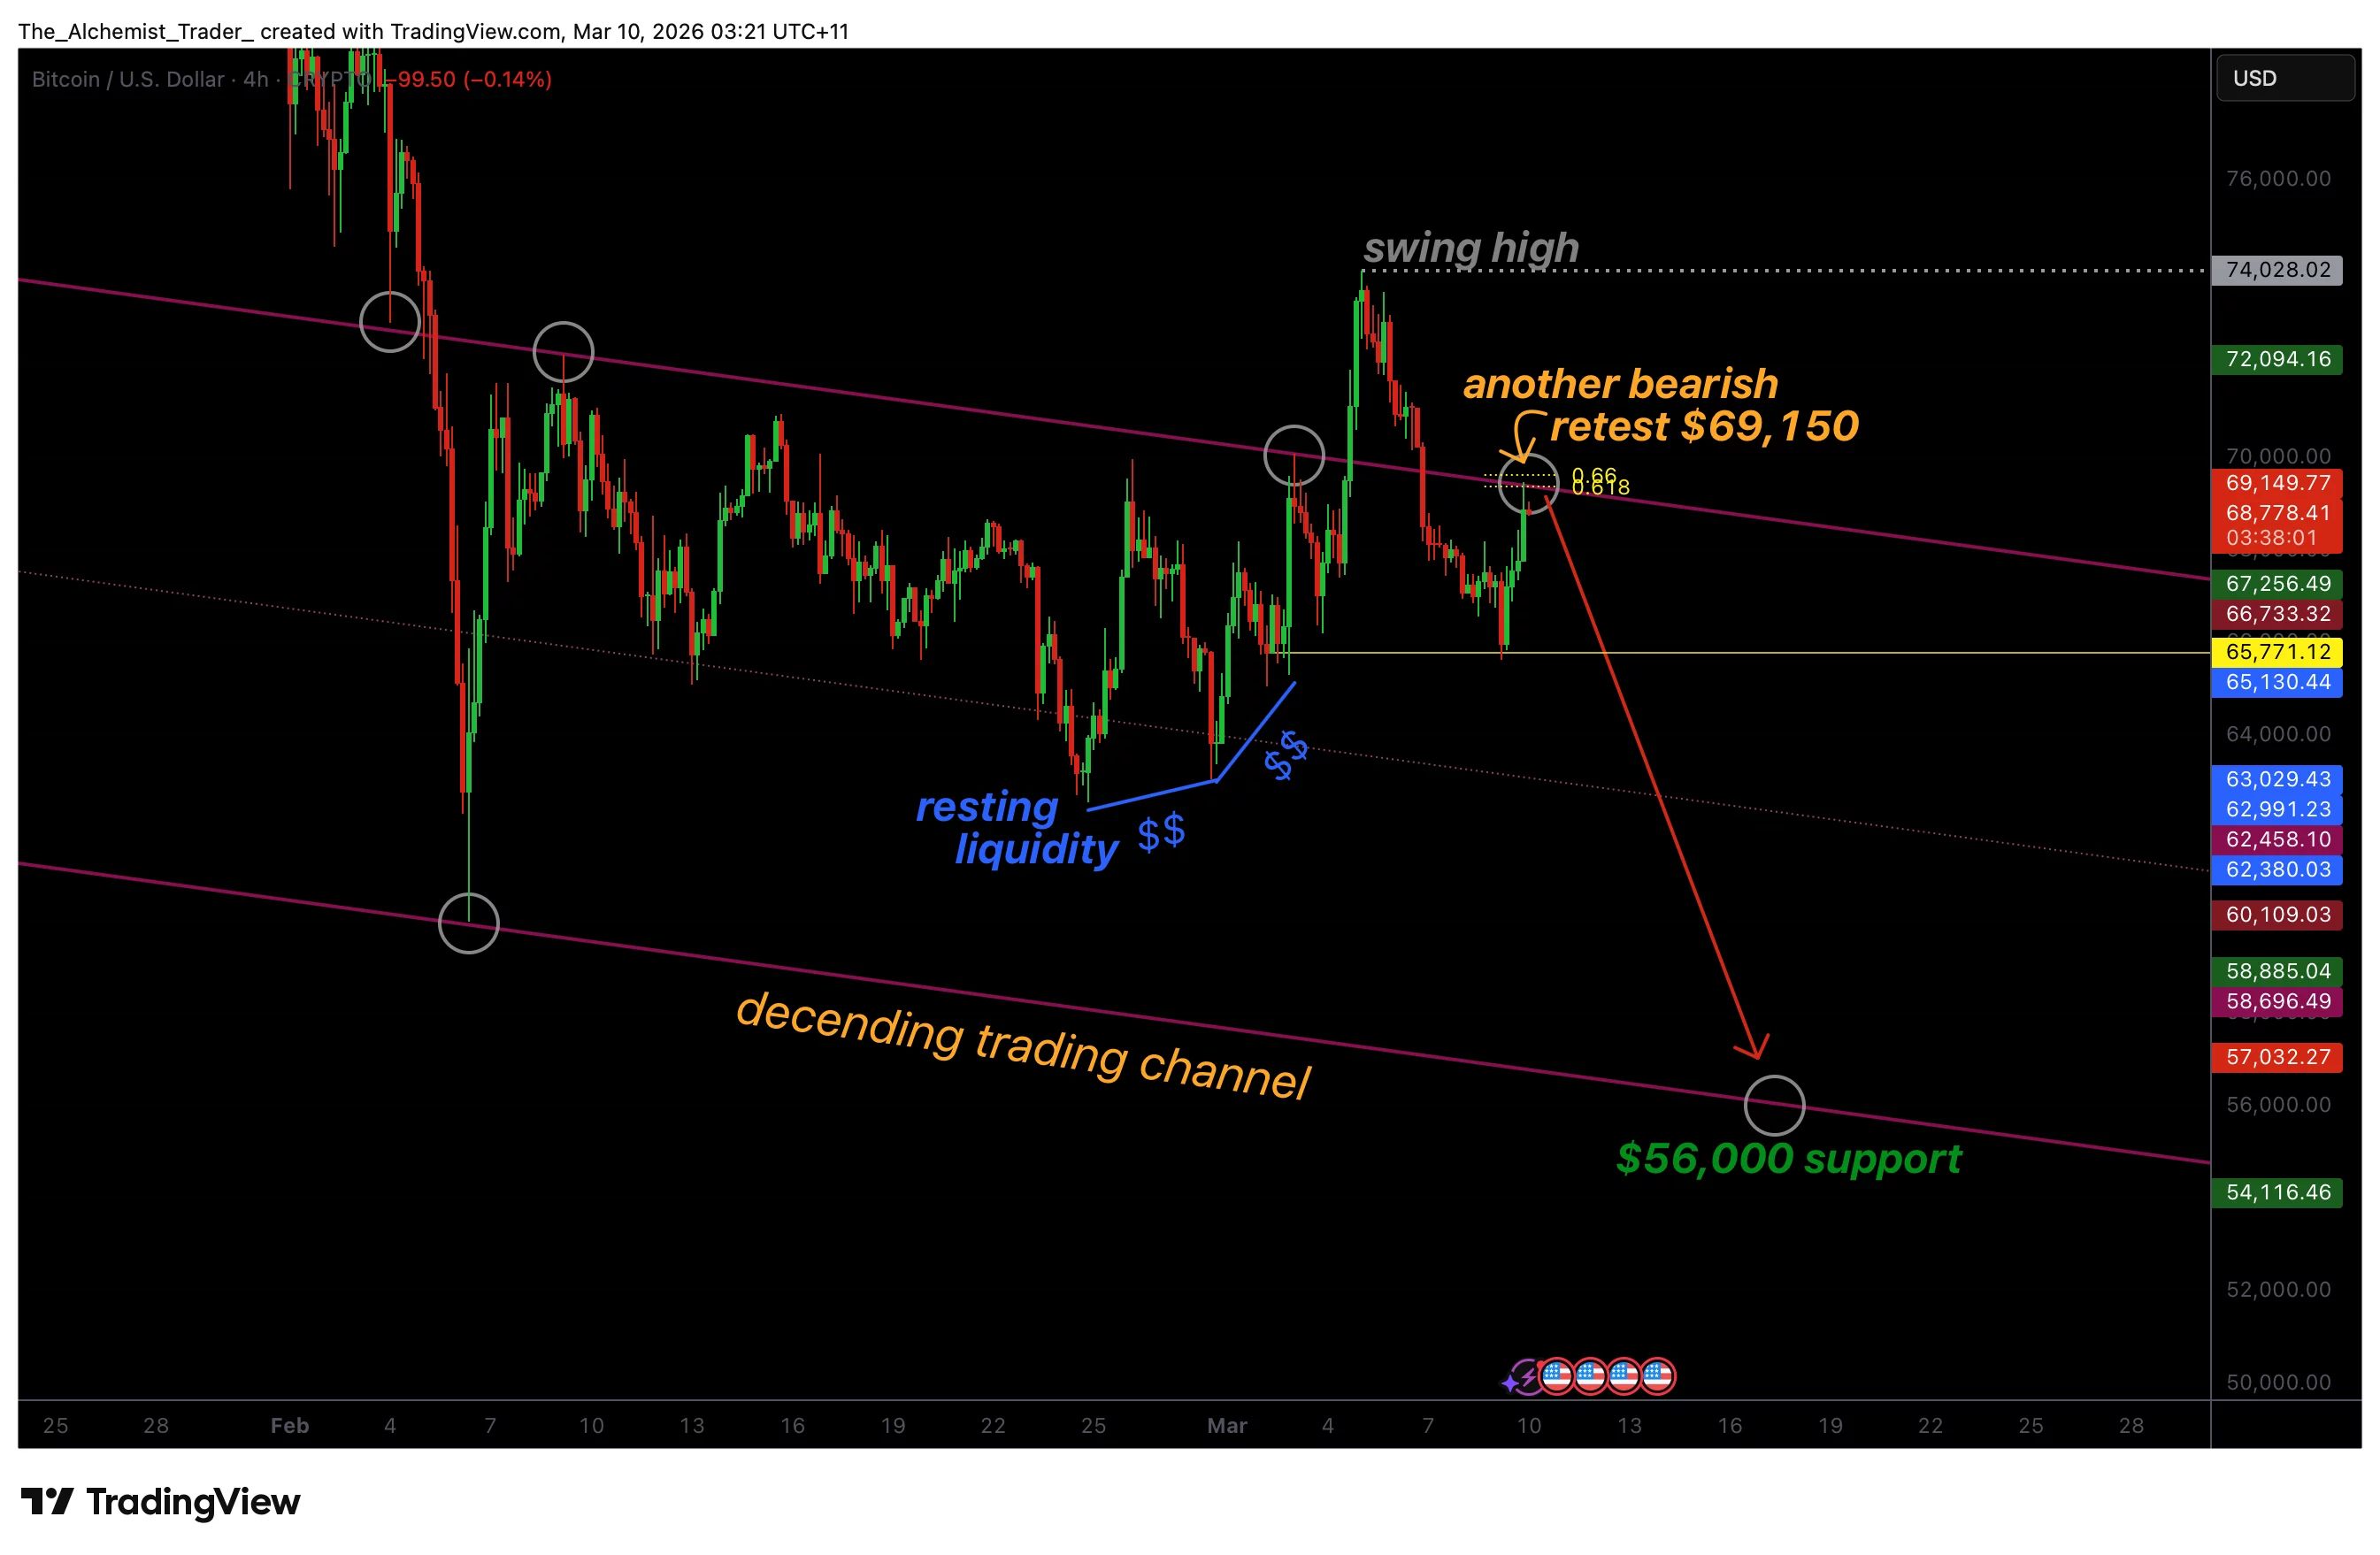
Bitcoin price is rising to channel resistance near $69,150. A rejection here could signal a bull trap and open the door for a reversal towards lower support near $56,000.
Conclusion
- Main resistance: Bitcoin testing the resistance of the descending channel nearby $69,150.
- Danger of bull trap: Failure to break higher can confirm a bearish test.
- Negative target: Possible turn to $56,000 – $58,000 support if rejected.
Bitcoin (BTC) price action is currently approaching an important resistance level that could determine the next major move in the market. After a recent recovery rally, BTC is now testing the upper boundary of the descending trading channel, a level that has historically rejected the price on several previous attempts.
While the short-term rally may appear to be upside, the broader technical structure suggests that this move could create a potential bull trap if resistance continues.
The main technical points of Bitcoin price
- Channel resistance: Bitcoin is testing the resistance of the descending channel nearby $69,150.
- Confirmed: After the price entered the trading range again, the high level above the range was considered invalid.
- Negative target: Confirmed rejection can cause a turn to $56,000 – $58,000 support.
Bitcoin’s current rally has pushed the price back to key technical resistance in a descending channel structure. This channel has guided price action for several weeks, and the upper boundary acts as a continuous rejection zone. Whenever Bitcoin approaches this area, sellers tend to prevent the price from making a sustained breakout.
The recent high is particularly important to understand the current structure of the market. The move initially appeared to signal a continuation of the uptrend, but subsequent retracements to the range indicated that the breakout lacked strength. In technical terms, this type of movement is often referred to as a range deviation, where the price temporarily breaks a key level before quickly returning to the previous trading environment.
With the price now returning to the test resistance near $69,150, the market could set up a bearish test of the same level that the price rejected earlier. Bearish tests occur when the price returns to the resistance zone after holding above it. If sellers defend this level again, it reinforces the descending channel structure and increases the likelihood of another move.
This is while Bitcoin has also passed 20 million coins mined, which continues to see its downside as macro volatility, the loss of BTC, and the network’s shift to secure payment continue to shape its long-term future.
From a liquidity perspective, the market tends to move in directions where stop orders and quiet liquidity are concentrated. Currently, most of this liquidity is under current price action. This includes pools of liquidity that have formed during earlier stages of consolidation, particularly around the lower boundary of the trading range.
Because of this liquidity imbalance, the probability of a negative rotation increases if resistance persists. Markets often move into these liquidity zones because they provide the necessary volume for larger participants to complete trades.
In the case of Bitcoin, this means that the path of least resistance may be lower unless buyers push the price above the channel’s resistance. This is also at a time when oil prices have increased by more than 60% this year amid rising tensions around the Strait of Hormuz, increasing macro pressure on risky assets.
Another factor reinforcing the bearish scenario is the broader market structure within the descending channel. As long as the price remains within this structure, rallies to the upper bound are usually considered corrective moves rather than trend reversals.
Without a decisive break from the channel resistance, the dominant trend will remain neutral in the short term.
What to expect in future price action
Bitcoin is currently at a decisive technical level as the price is testing the channel resistance near $69,150. If the sellers reject this level again, the probability of a turn to the lower support zone of $56,000 to $58,000 increases.
However, a sustained break above the channel resistance cancels the bearish scenario and could turn the momentum back in favor of the bulls.


