
Autism is a spectrum. This metaphor is a useful way of explaining why autism looks and feels so varied between different people. Since 2013, it has been baked into the name of the diagnosis itself, autism spectrum disorder (ASD). But what does this spectrum look like?
It’s not just a one-dimensional scale from “more autistic” to “less autistic,” which would collapse so much of the diversity that the spectrum metaphor is meant to showcase. There is no single characteristic that defines autism: it encompasses differences in social communication skills, interests, sensory sensitivities and more. Each person’s profile is unique. This graphic, based on clinicians’ ratings of actual people using the Autism Symptom Dimensions Questionnaire, reveals a more nuanced “spectrum” of differences.
And this picture does not take into account how people’s profiles change over time in response to treatments, life circumstances or age. Nor does it measure individuals’ general cognitive ability, which researchers treat as a separate but important function that can influence someone’s particular constellation of traits.
On supporting science journalism
If you like this article, please consider supporting our award-winning journalism by subscribes. By purchasing a subscription, you help secure the future of impactful stories about the discoveries and ideas that shape our world today.
Not all of these characteristics are impairments that should be treated. “Someone not making eye contact is useful information for diagnosing autism,” but it’s not necessarily an appropriate target for intervention, says Ari Ne’eman, co-founder of the Autistic Self Advocacy Network and a health policy researcher at Harvard University. Many of these traits are best thought of as normal human variation rather than something to be treated or changed, says Ne’eman.
A spectrum in many dimensions
Each of the 39 wedges in the circle represents one question in the Autism Symptom Dimensions Questionnaire. The characteristics associated with each question (listed below) are grouped into key symptom factors—the main aspects of behavior that evaluators look for when assessing someone for autism.
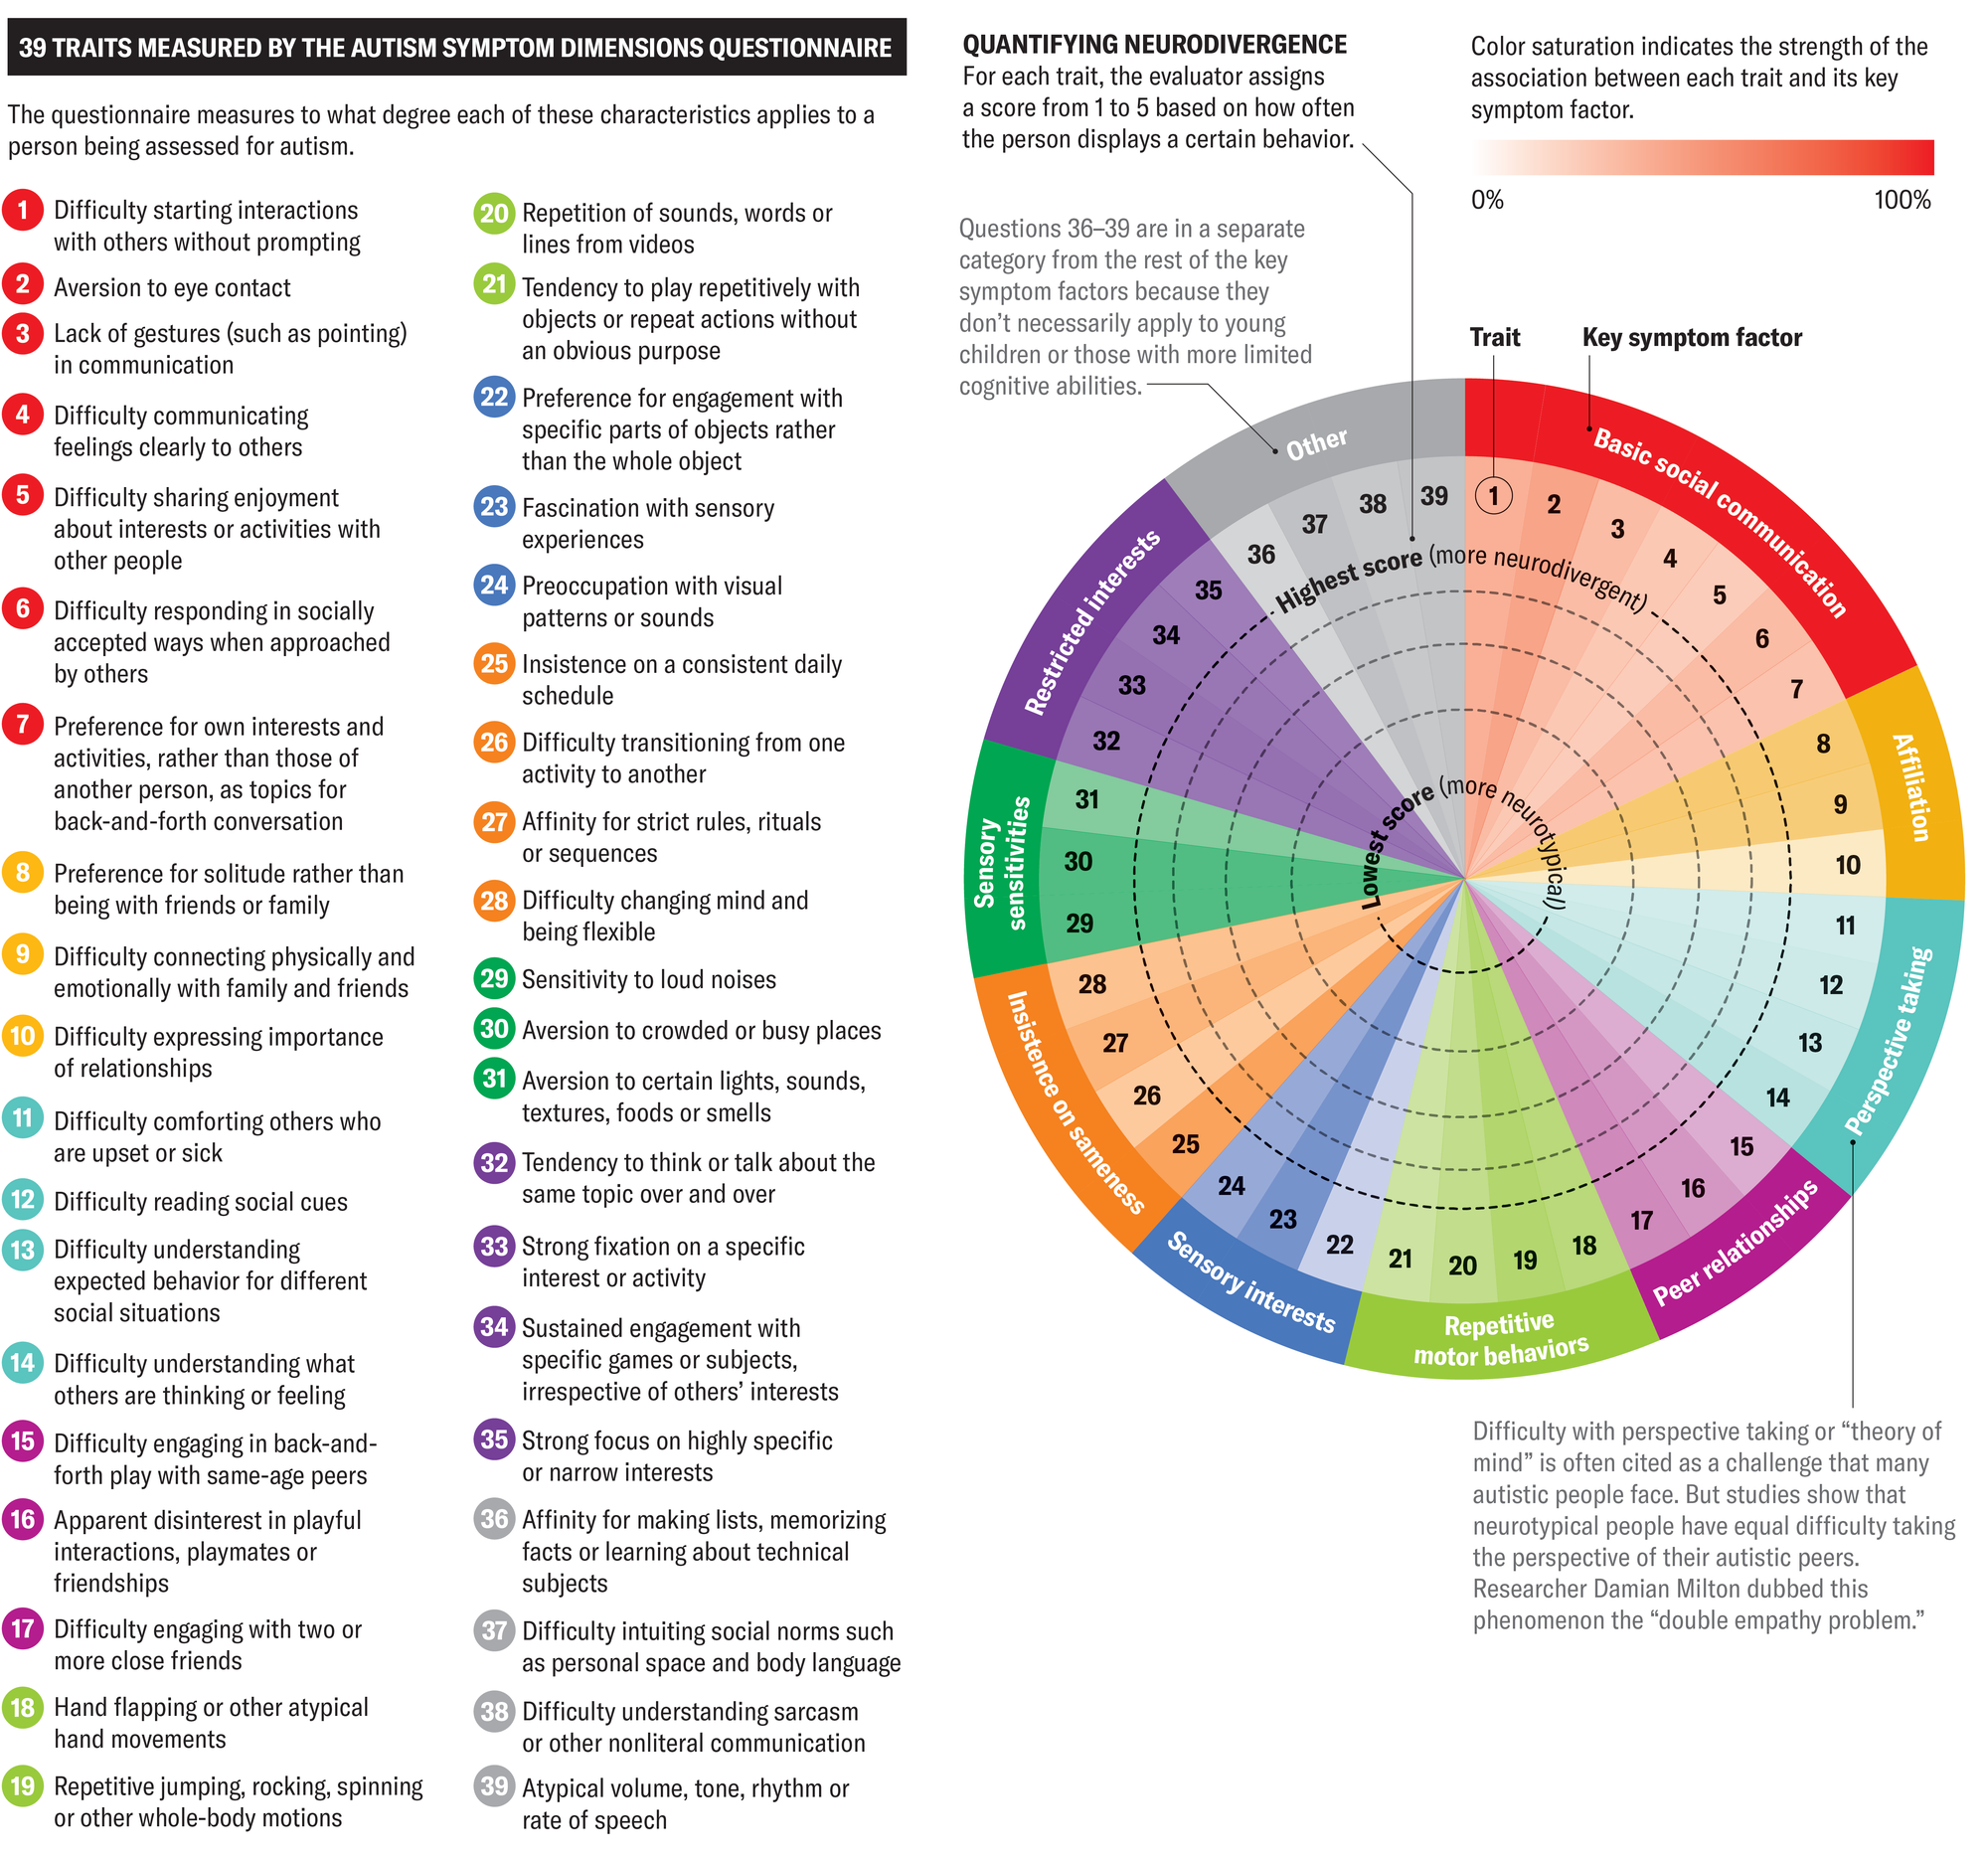
Amanda Montañez; Source: “The Autism Symptom Dimensions Questionnaire: Development and Psychometric Evaluation of a New, Open-Source Measure of Autism Symptomatology,” by Thomas W. Frazier et al., in Developmental medicine and child neurologyVol. 65, No. 8; August 2023 (data)
Variation across individuals
These charts represent questionnaire responses for three different autistic individuals. This data reflects each person’s strengths and challenges at their current stage of development and may change over time.
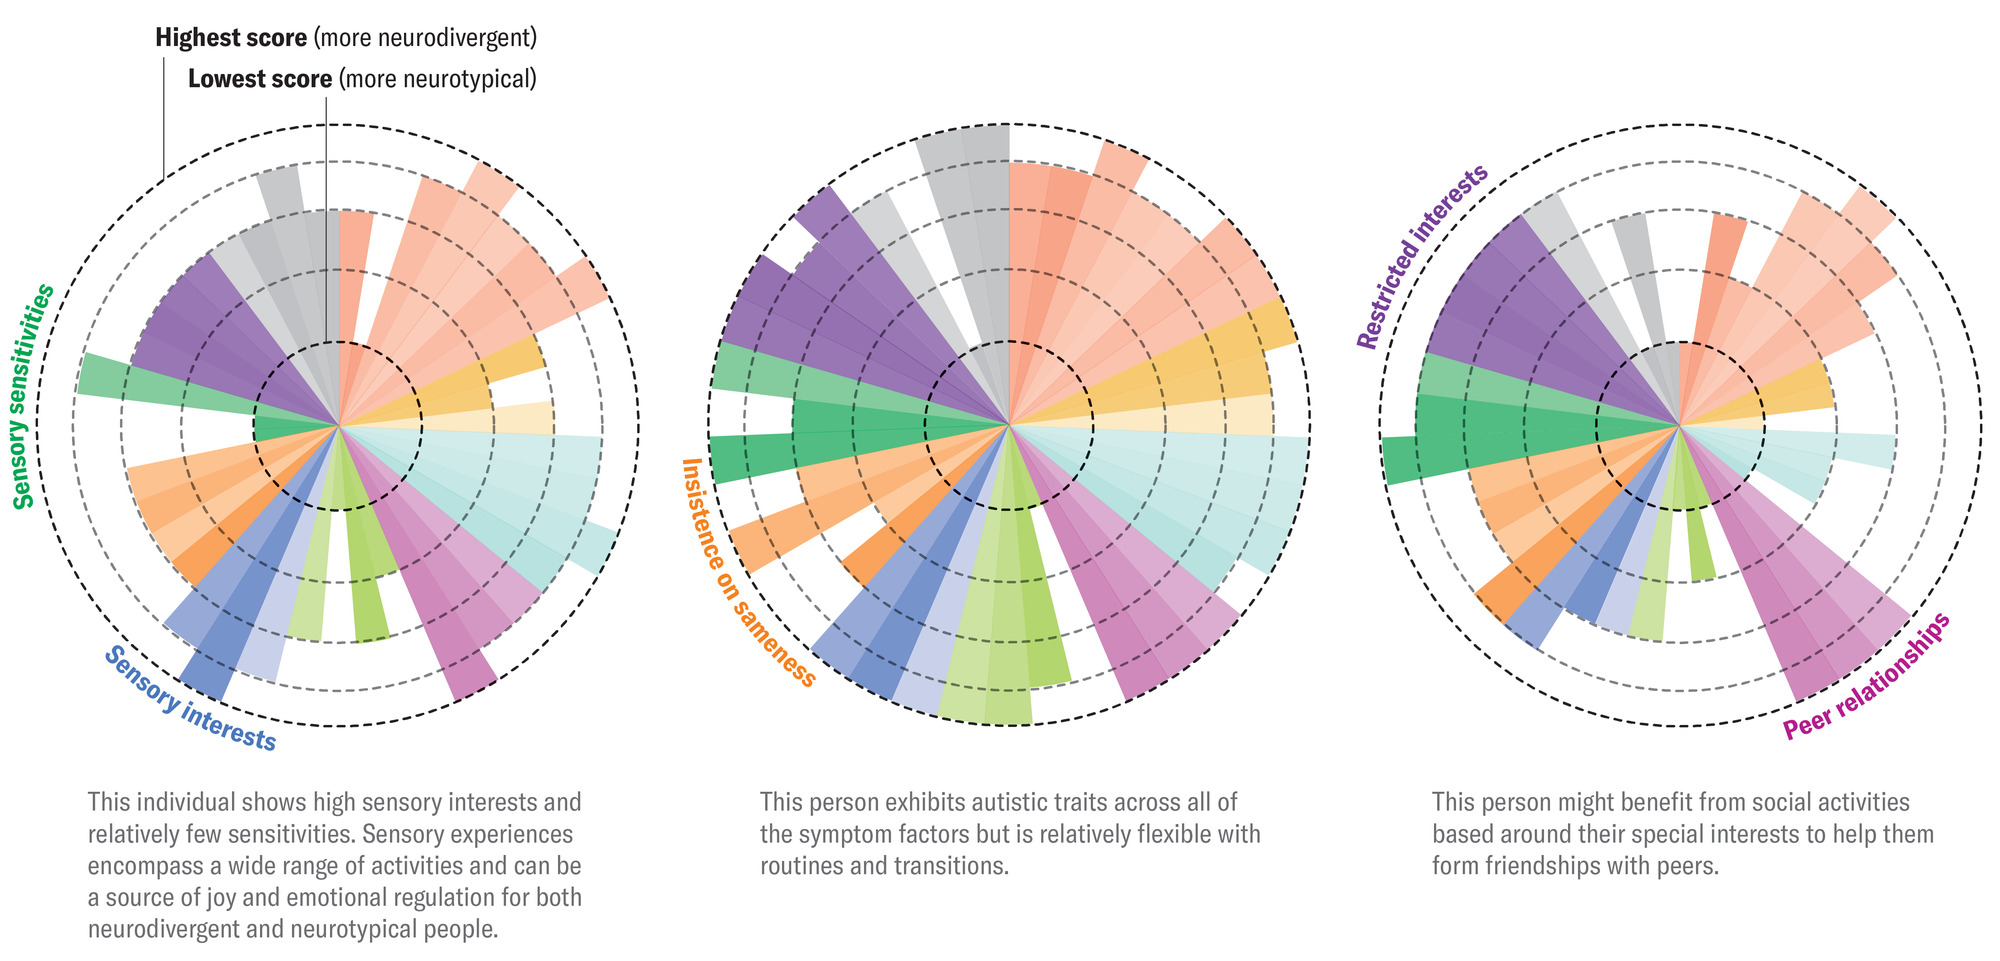
Amanda Montañez; Source: “The Autism Symptom Dimensions Questionnaire: Development and Psychometric Evaluation of a New, Open-Source Measure of Autism Symptomatology,” by Thomas W. Frazier et al., in Developmental medicine and child neurologyVol. 65, No. 8; August 2023 (data)
It’s time to stand up for science
If you liked this article, I would like to ask for your support. Scientific American has served as an advocate for science and industry for 180 years, and right now may be the most critical moment in its two-century history.
I have been one Scientific American subscriber since I was 12 years old, and it helped shape the way I see the world. SciAm always educates and delights me, and inspires a sense of awe for our vast, beautiful universe. I hope it does for you too.
If you subscribe to Scientific Americanyou help ensure our coverage is centered on meaningful research and discovery; that we have the resources to report on the decisions that threaten laboratories across the United States; and that we support both budding and working scientists at a time when the value of science itself is too often not recognised.
In return, you receive important news, captivating podcasts, brilliant infographics, can’t-miss newsletters, must-see videos, challenging games, and the world of science’s best writing and reporting. You can even give someone a subscription.
There has never been a more important time for us to stand up and show why science is important. I hope you will support us in that mission.


