
Hyperliquid prices are testing $35 as oil futures continue to rise, driving record trading volume and attracting institutional attention.
Conclusion
- Hyperliquid is trading near the top of its weekly range at $35.20.
- An increase in perpetual oil contracts, driven by geopolitical tensions, has led to an increase in trading volume
- HYPE is above the average Bollinger Band and $35 is acting as a key resistance that could move to $38-40.
As buyers pushed the price above its weekly range, the token was trading at $34.69 at the time of writing, up 6.6% from the previous day. Hyperliquid (HYPE) has moved between $29.61 and $35.20 over the past seven days, with the latest surge pushing the token closer to its potential breakout zone.
The asset is currently up in all major timeframes, with gains of 9% over the past week, 11% over the past 30 days and 141% over the past year. Despite the strong long-term gains, the token is still about 41% off its high of $59.30 since September 2025.
Market activity increased during the last move. The 24-hour trading volume reached $2.39 billion, up 21% from the previous day. CoinGlass data shows open interest at $1.40 billion, a slight decrease of 0.22%, suggesting that some traders have taken profits while the price continues to rally.
Oil-related perps drive the main activity on the platform
Much of Hyperliquid’s recent trading growth has come from activity in the energy markets, particularly the CL-USDC perpetual contract, which tracks West Texas Intermediate (WTI) crude oil.
Oil trading volume on the platform has increased significantly in recent days as oil prices have reacted to rising geopolitical tensions in the Middle East. Reports of military escalation between the US, Israel and Iran, as well as potential threats to shipping routes through the Strait of Hormuz, have raised concerns.
The oil market rallied in the wake of these developments, and WTI crude briefly traded between $110 and $120 per barrel.
As a result, trading activity on the CL-USDC market increased. Daily volume has topped $1.2 billion, with some sessions ranging from $1.15 billion to nearly $2 billion. Before the recent geopolitical events, the contract’s daily trading volume was around $21 million.
Open interest in the oil-related contract also increased, reaching approximately 170-195 million dollars. At the same time, the perpetual HIP-3 unlicensed market on Hyperliquid recorded more than $1.2 billion in total open interest.
Rapid price swings in crude markets have also led to liquidations. About $40 million in positions were wiped out within 24 hours, with short sellers accounting for most of the losses during the rally.
The overall activity of the platform increased along with oil trading. Hyperliquid’s daily total volume recently exceeded $10 billion, with non-crypto markets such as commodities, stocks, and metals taking up the largest share of trading.
In some trading sessions, these markets accounted for more than 30% of the platform’s total volume.
The increase also shows that traders are turning to the platform as a round-the-clock place to react to geopolitical developments, especially during hours when traditional exchanges such as the Chicago Mercantile Exchange are not open.
Technical analysis of hyperliquid price
From a chart perspective, Hyperliquid is testing an important resistance zone near $35. Since it rejected the price in February, this level is important for traders.
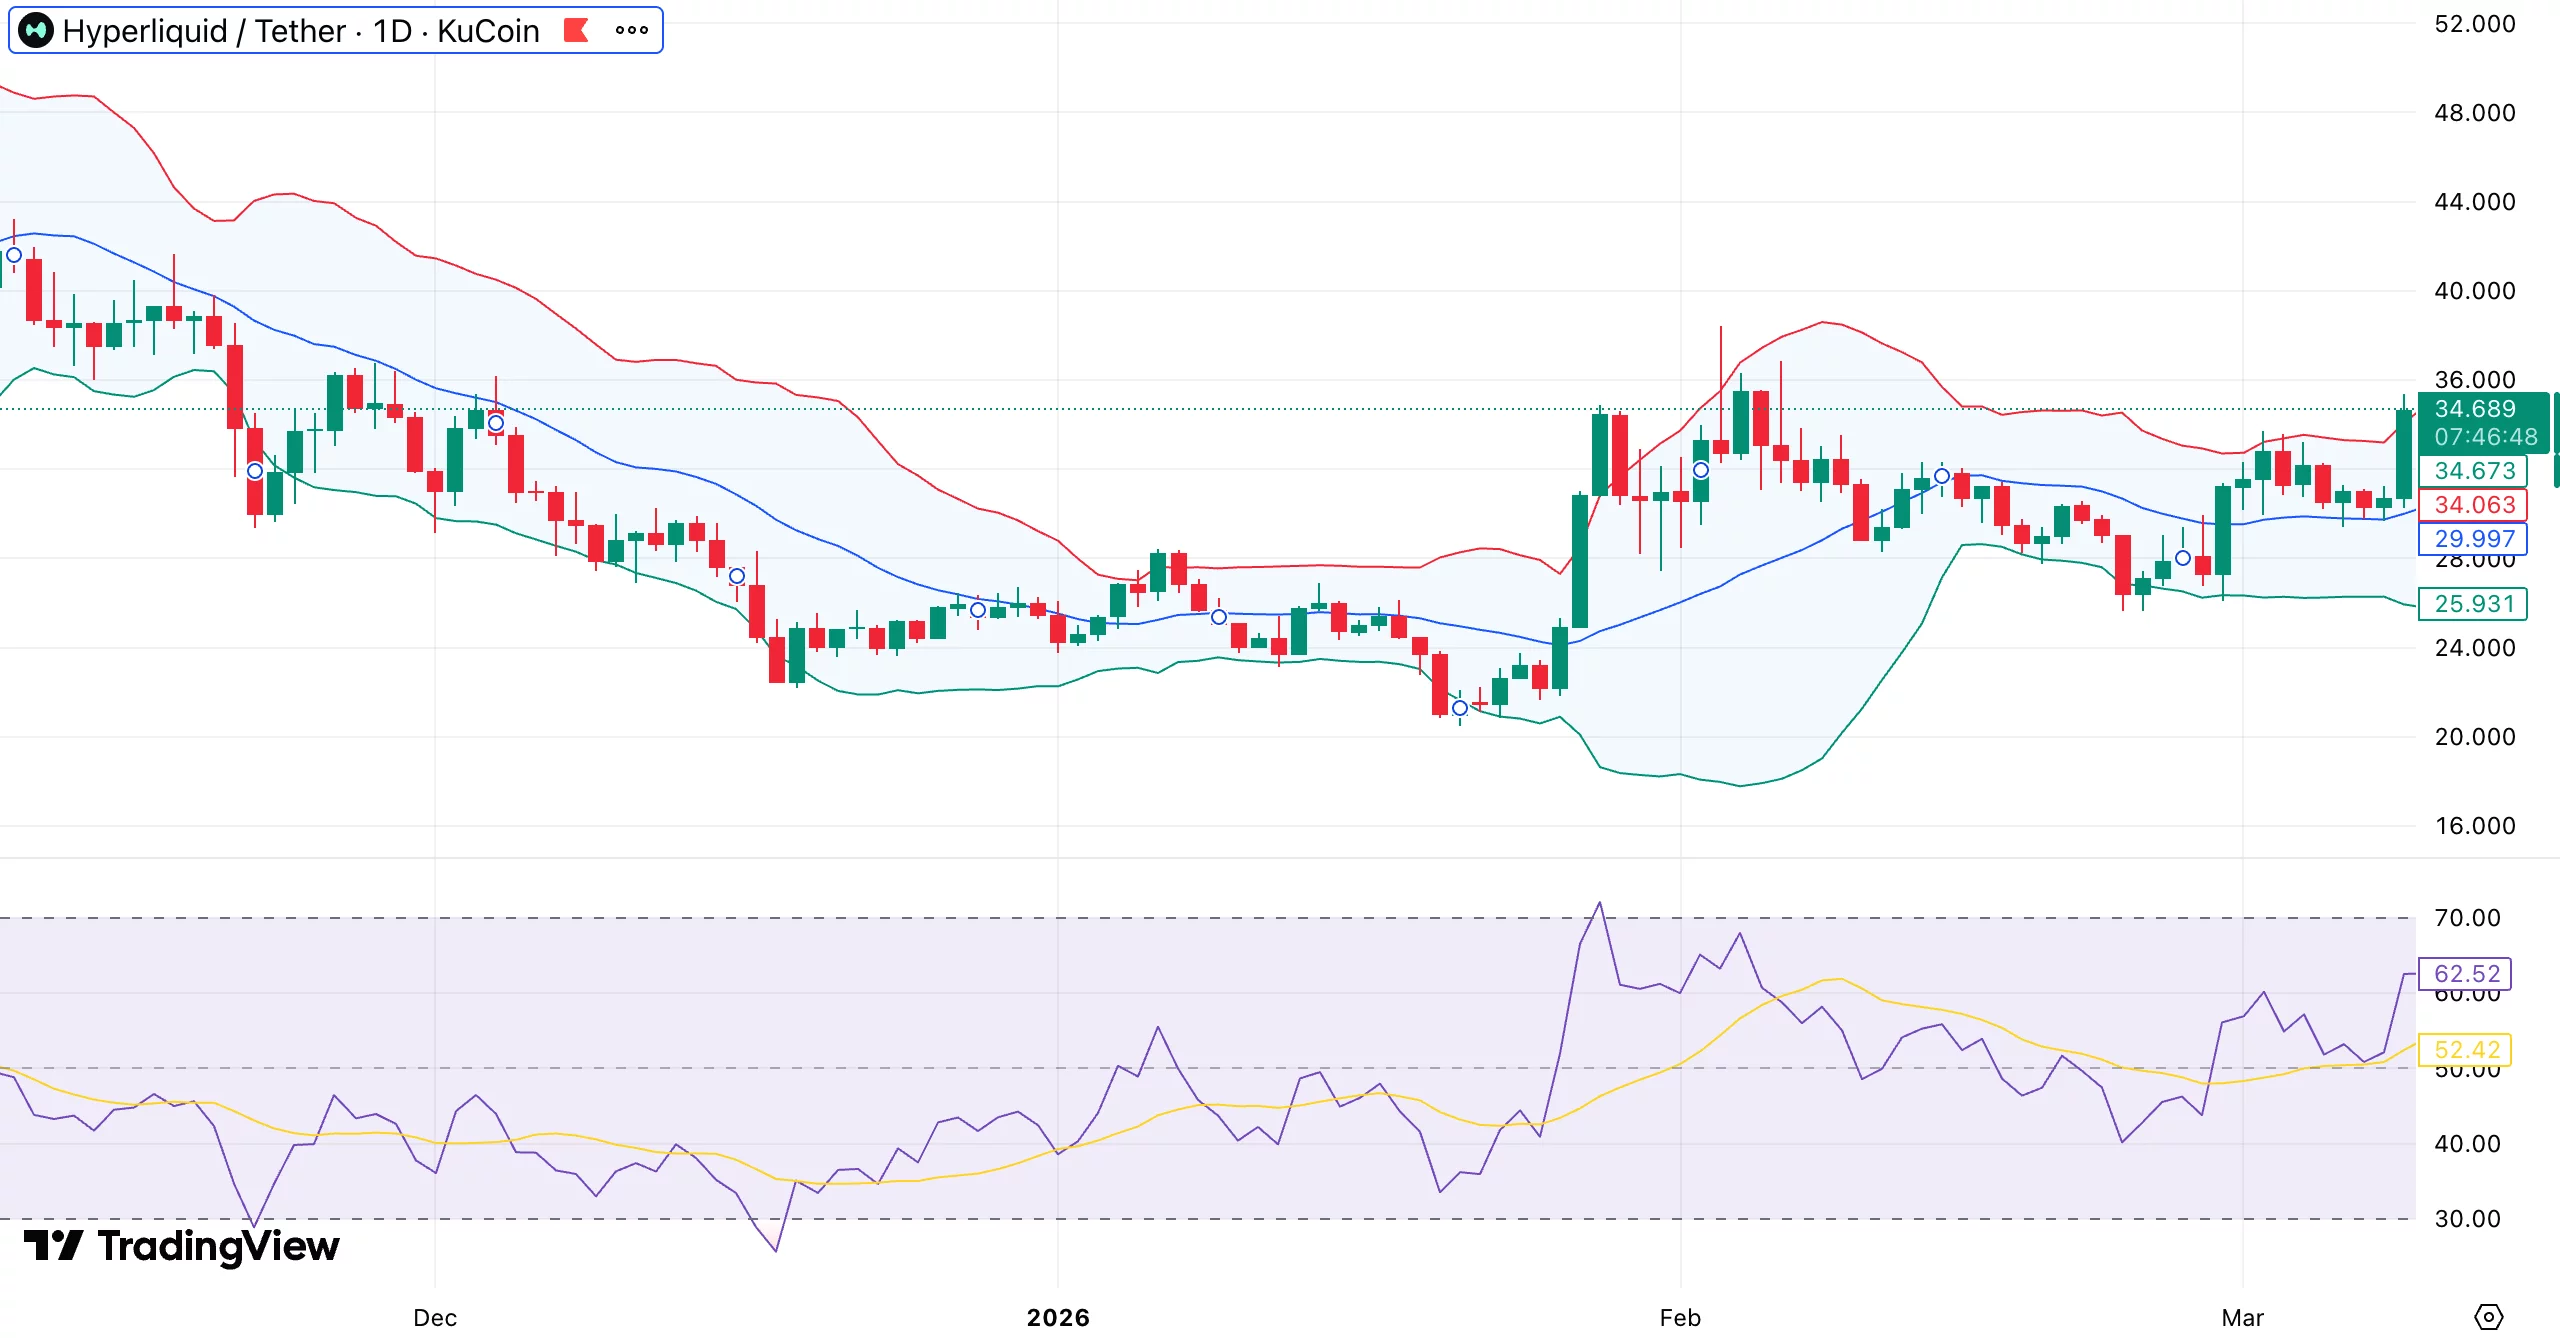
A break can be indicated by a daily close above $35, opening the door to the $38-40 range. Momentum indicators are currently showing a bullish bias. The token is trading above the average line of the Bollinger Band around $30, which acted as short-term support during the uptrend.
Since late February, the price has made a series of lows, suggesting that buyers come in whenever there is a dip. The relative strength index, which is currently around 62, shows that while the market is still below the overbought limit.
In addition, volatility is increasing. Bollinger Bands are expanding, a pattern typically seen when markets are preparing for a stronger directional move.
If the price breaks above $35, this move could pave the way to $38 and possibly $40 as the next upside level. However, if the level is held as a resistance and the price is rejected, the token can return to the $30 support zone, where the demand was returned earlier.


