

Traders watching Bitcoin rally in line with US stocks last week may have jumped to the wrong conclusion. According to NYDIG, a financial services firm focused on Bitcoin, the visual parallel is misleading.
Only about 25% of BTC’s price movement can be traced back to its relationship with the stock markets. The remaining 75% are driven by forces that have nothing to do with the S&P 500 or the Nasdaq.
Greg Cipolaro, head of NYDIG research, made the case in a memo Friday. His argument: when Bitcoin and software stocks move in the same direction, it is not because they are structurally related. Both are responding to the same macro pressures — the kind that push investors broadly into or away from riskier assets.
“The conclusion that Bitcoin and software stocks are structurally integrated is overblown,” Cipolaro wrote.
A shared macro trigger, not a common personality
Bitcoin’s 90-day correlation with software stocks rose after the cryptocurrency hit a record high above $126,000 in early October. But Cipolaro noted that its correlation with the S&P 500 and the Nasdaq rose at the same time.
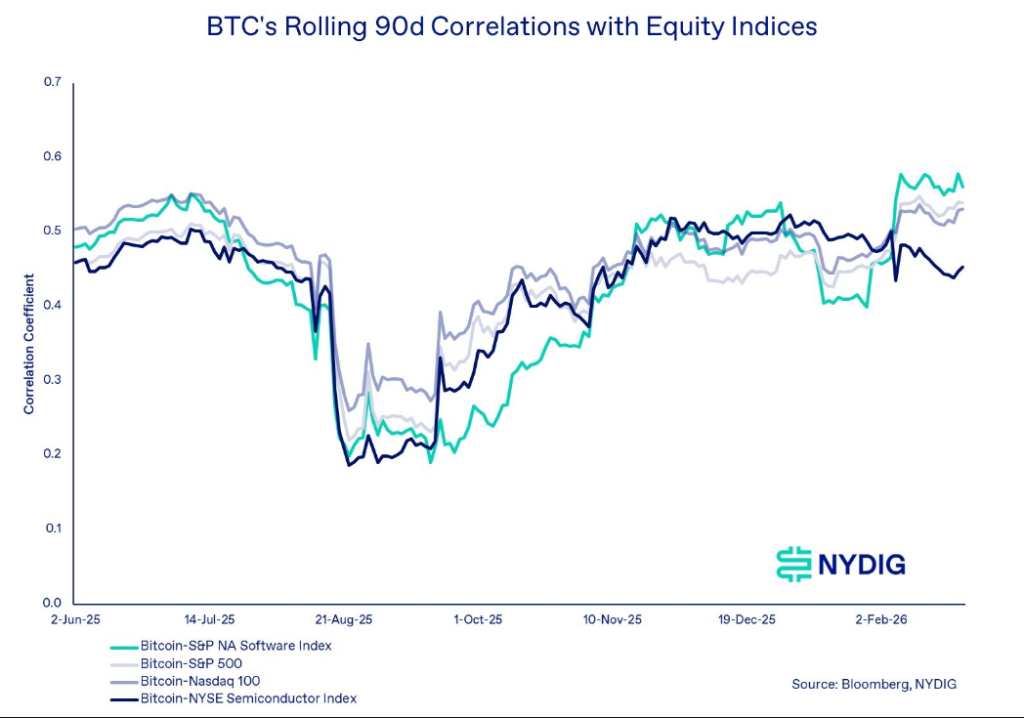
90-Day Rolling Correlation Between Bitcoin and Major Indices. Source: NYDIG
Liquidity sensitive assets
This pattern shows that volatility is not unique to software stocks – it’s a broader phenomenon related to investor appetite for risk.
The data shows that both alpha crypto and software stocks are viewed as long-term and liquidity-sensitive assets. Both go up when macro conditions favor risk-taking. When they don’t, both strike out.
This shared sensitivity to monetary conditions is what drives the parallel movement rather than a deeper connection between the two.

Image: CoinFlip.tech
The “Bitcoin is a tech stock” story has been around before. It tends to occur during periods when correlations are high and assets are moving in reverse. Cipolaro’s note goes directly back to that frame.
Individual Crypto drivers keep it in its own category
Despite the high correlation, NYDIG argues that Bitcoin has a market structure that sets it apart. Network activity, adoption trends, and policy developments all shape its price in ways that software companies don’t.
These factors, Cipolaro said, support Bitcoin’s role as a portfolio diversifier, even as correlations between assets rise.
BTCUSD trading at $67,465 on the 24-hour chart: TradingView
One tension the note acknowledges is Bitcoin’s failure to trade like gold. It has long been called “digital gold,” but reports suggest it is no longer being bought as a hedge against economic volatility.
Traders seem to divide it according to the risk curve rather than any monetary belief.
Relationships with stocks are now elevated. But based on NYDIG’s analysis, they’re far from the full story of what’s driving Bitcoin’s price — and that’s because it’s called a stock.
Featured image from ION, chart from TradingView
Editing process because bitcoinist is committed to delivering comprehensive, accurate and unbiased content. We adhere to strict sourcing standards and every page is carefully reviewed by a team of top technology experts and experienced editors. This process ensures the integrity, relevance and value of our content to our readers.


