
Bitcoin prices are showing early signs of a possible trend reversal after the chain’s key indicator showed a rare signal, even as the market continues to consolidate.
Conclusion
- The Bitcoin exchange rate has broken above its 90-day moving average for the first time since early 2025.
- BTC is consolidating between $67k and $72k after a sharp decline from the $95k region.
- A move above $72,000 could open the way to the $75,000-$78,000 resistance zone.
Bitcoin (BTC) was trading around $70,080 at the time of writing. This represents a 3.7% drop over the last 24 hours. However, the price remains at the top of its weekly trading range, which currently ranges from $63,176 to $73,669.
The short-term weakness did not erase the gains made in the previous week. BTC is still up about 5.8% during this period. However, over the past month, the trend has been slightly negative, with assets falling by around 8%. Compared to its October 2025 peak of $126,080, Bitcoin is still trading about 44% below its all-time high.
Market participation has also slowed down. Over the past 24 hours, trading volume has dropped to $47.99 billion, representing a drop of over 32%. Such a pullback in activity is common during consolidation phases, when traders step back and wait for clearer direction.
The derivatives market tells a similar story. Data from CoinGlass shows that trading volume in derivatives contracts fell 23% to $72 billion. Open interest also declined, falling 8% to $45 billion as some leveraged positions were closed.
The IFP indicator indicates a renewed risk appetite
In this quieter market environment, fresh chain data is attracting attention. CryptoQuant analysts report that Bitcoin’s inter-exchange flow pulse has risen above its 90-day moving average.
According to a March 6 report by CryptoQuant contributor RugaResearch, the change marks the first time the metric has crossed that level in nearly a year.
To understand why this is important, it helps to look at what the indicator measures. IFP tracks Bitcoin transfers between spot exchanges and derivatives platforms.
Increased flows into derivatives venues often indicate that traders are preparing leveraged positions in anticipation of a potential upside. As the movement moves to spot exchanges, speculation in the market tends to decrease.
Revisiting historical data adds more context. Since 2016, similar IFP crossovers have frequently appeared near the early stages of bullish cycles. That said, the signal doesn’t always translate into immediate price action. In some cases, the market took time to react.
The benchmark had spent nearly a full year below its long-term average before this latest development. It dipped in early 2025 and stayed there for the rest of the year, making it one of the longest negatives on record for the metric.
Bitcoin price technical analysis
On the price chart, Bitcoin seems to be stabilizing after a sharp decline earlier in the year. The drop started at $95,000 to $100,000 and eventually brought the price down to around $63,000, where buyers finally came in.
After reaching this level, the price movement was mostly sideways. This type of behavior often indicates that selling pressure is easing while demand is slowly returning.
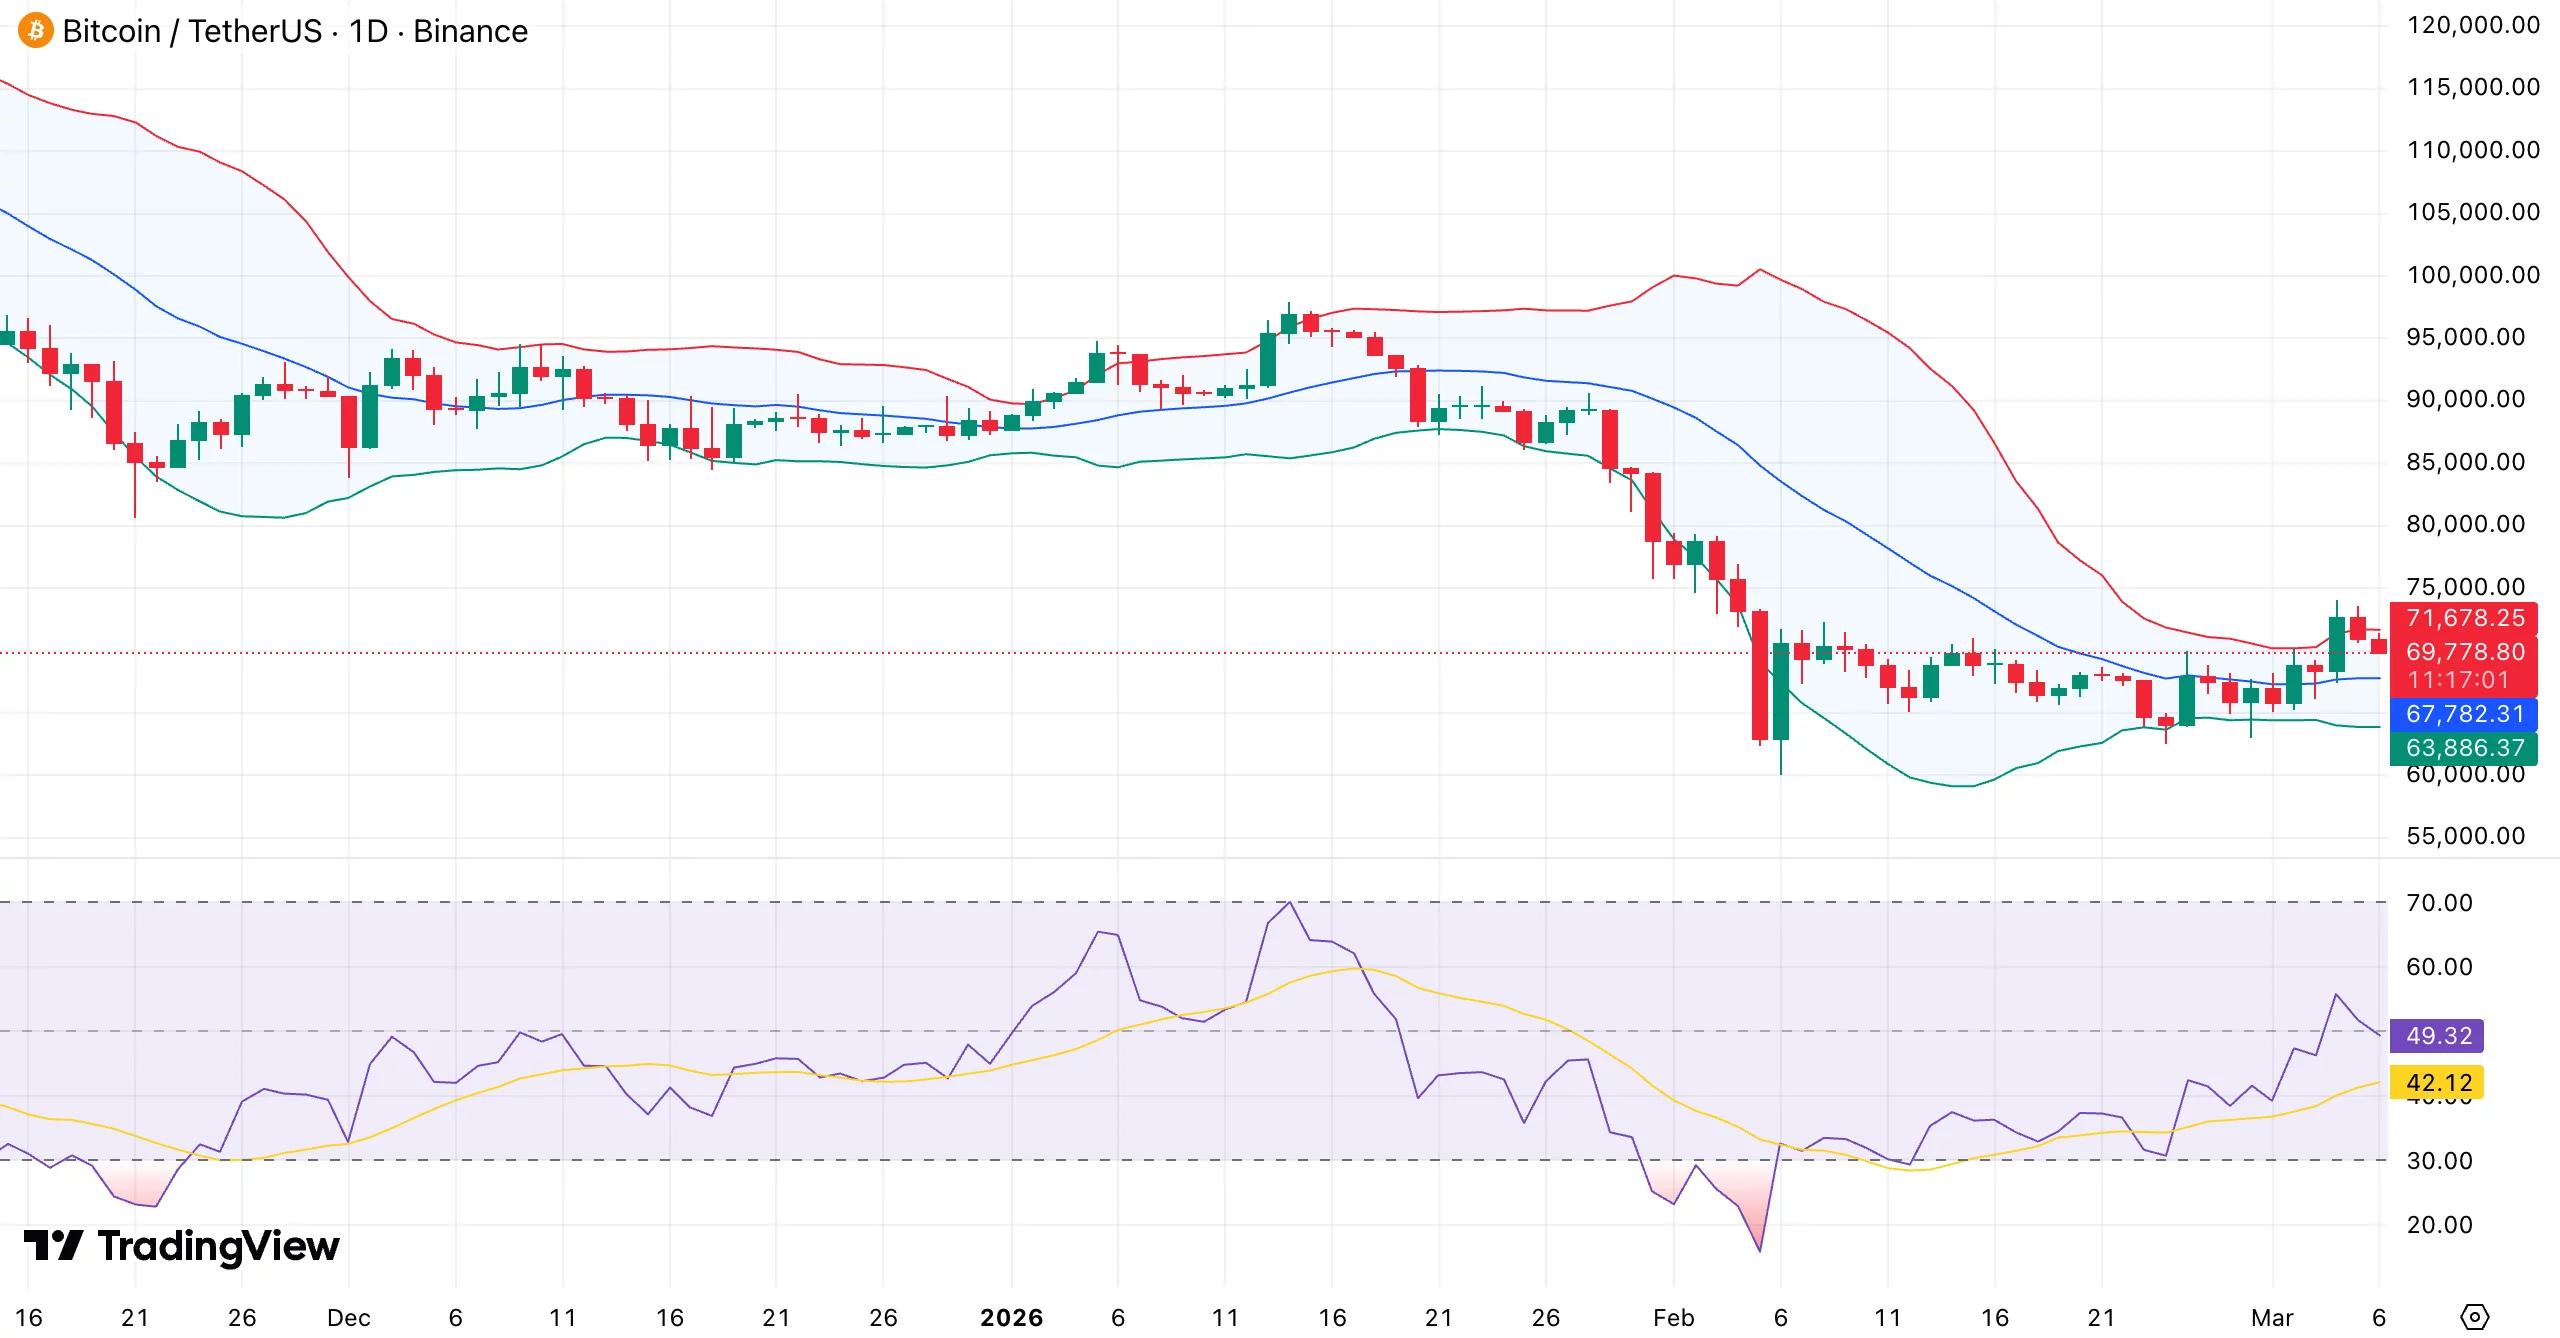
For several weeks, BTC has traded in a relatively narrow corridor between $67,000 and $72,000. Markets often behave this way during rally phases, when participants quietly reset their positions before the next important move.
The immediate barrier is $72,000. If buyers are able to push the price above this level and have a strong daily close, a breakout from the range may follow. In this case, the focus will likely shift to the $75,000-$78,000 zone, where another supply zone awaits.
Below the current price, support holds around $67,000. A deep demand zone can be found near $63,000, the same zone that stopped the previous sell-off.
This drop to $63,000 may not have been accidental. In many markets, prices briefly break below key support levels to initiate stop loss orders before reversing direction.
This type of movement is often referred to as a liquidity search. Bitcoin quickly recovered after reaching this zone and soon gained $67,000 as buying pressure overwhelmed the selling.
Volatility has also decreased as the range narrows. Historically, quieter phases like this precede stronger directional moves.
A break above $72,000 is likely to reinforce the upside momentum and open the way to a higher resistance level. On the other hand, a loss of support at $67,000 could weaken the recovery structure and bring the $63,000 request area back into focus.
 Today’s News: March 10")


